bindCommerce offers a number of analysis and reporting features that allow you to monitor sales, analyze product performance and support the making of strategic decisions to increase turnover.
Some of the available analytics features include:
- Real-time sales tracking
- Product performance analysis
- Comparison of sales data between different channels
- Identification of areas for improvement
Most reports are available in CSV, Excel, PDF and HTML formats.
The description of the most interesting reports follows.
Sales over time
The 2 reports "Monthly sales" and "Daily sales" offer an overview of the evolution of sales over time, with details on a daily or monthly level.
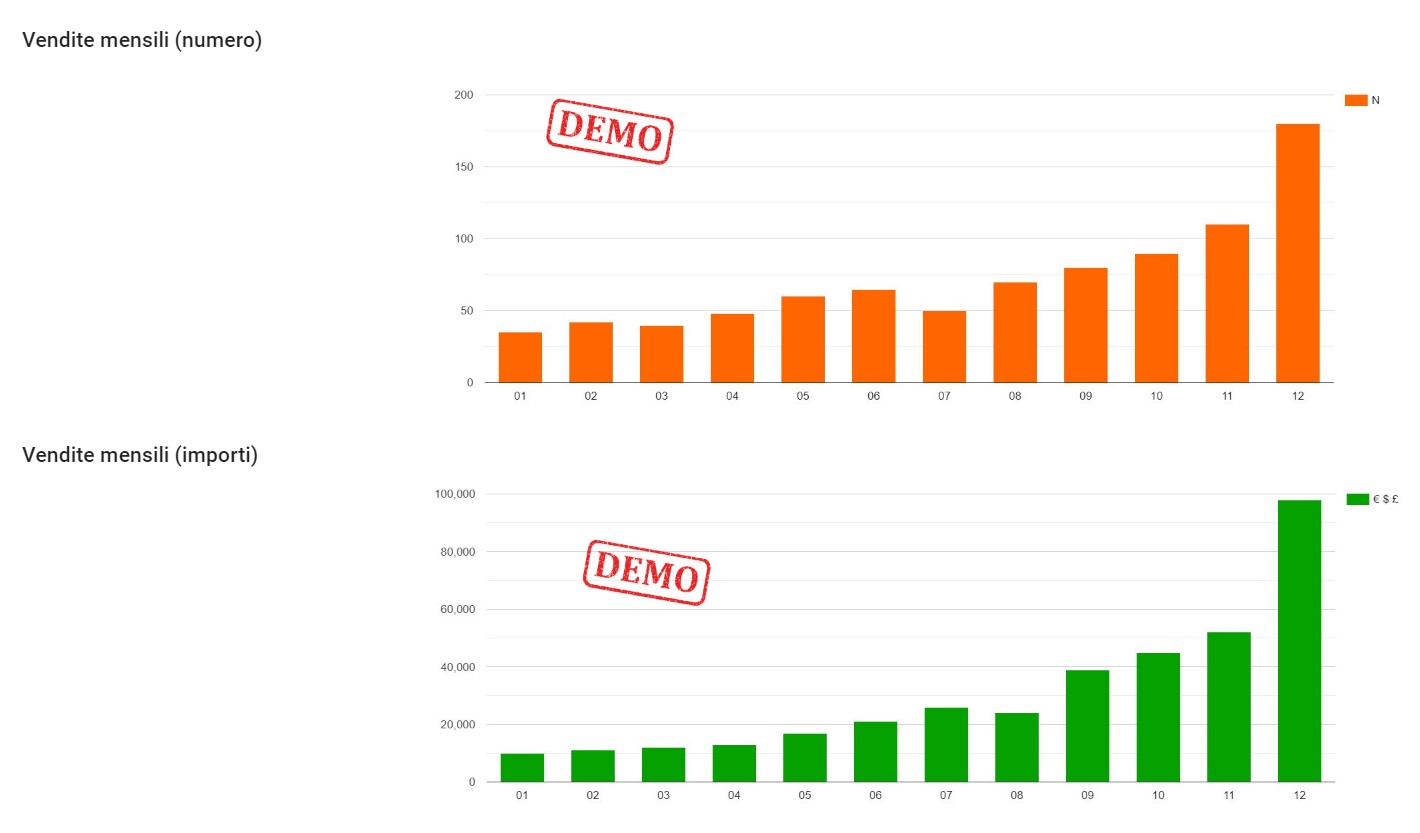
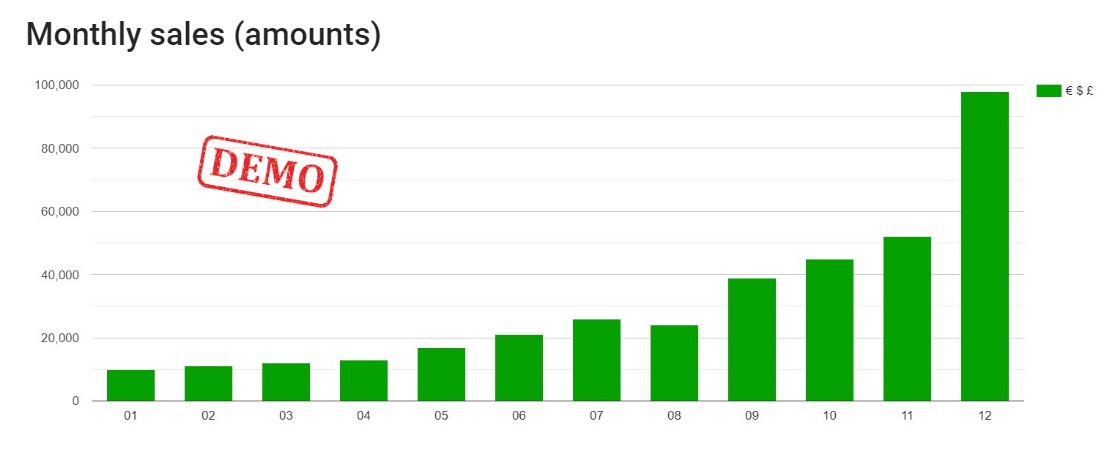
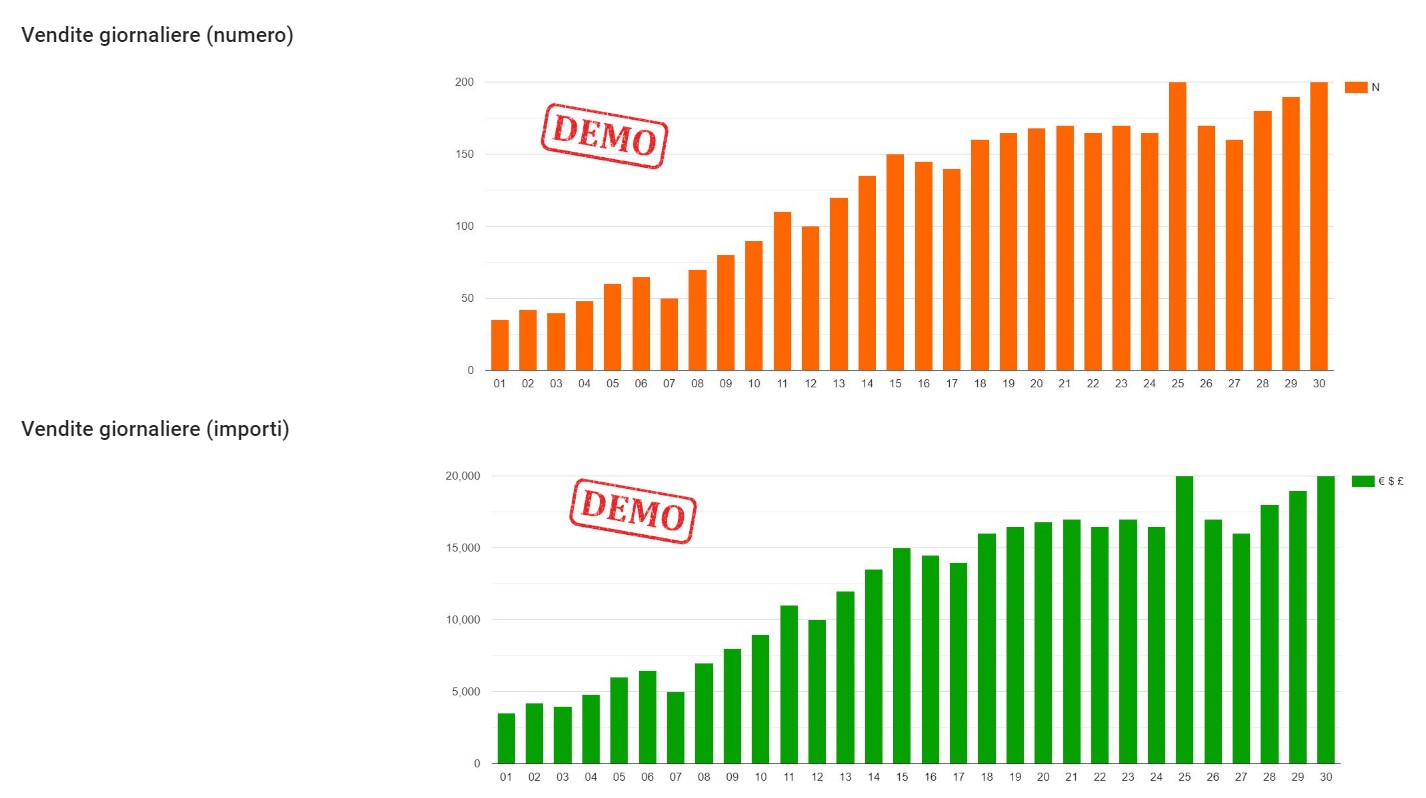
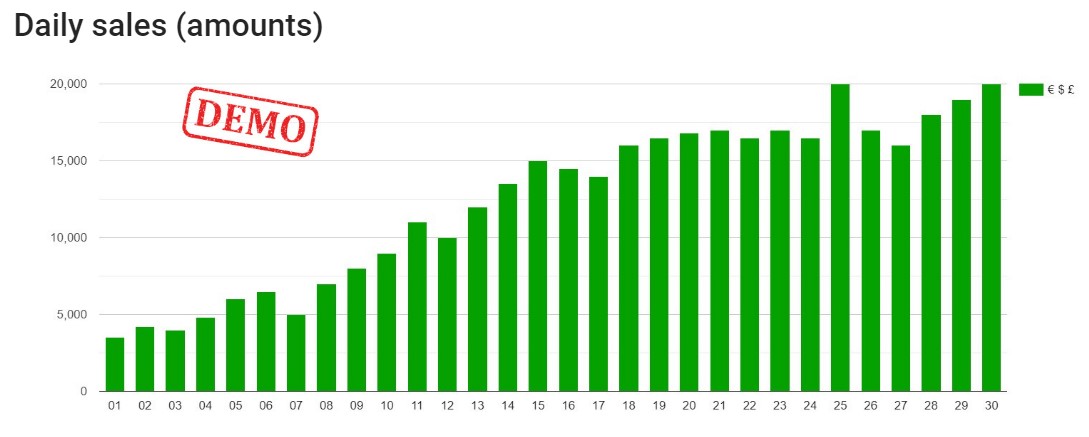
Each of the reports is visible in graphic form, and can also be downloaded as detailed data.
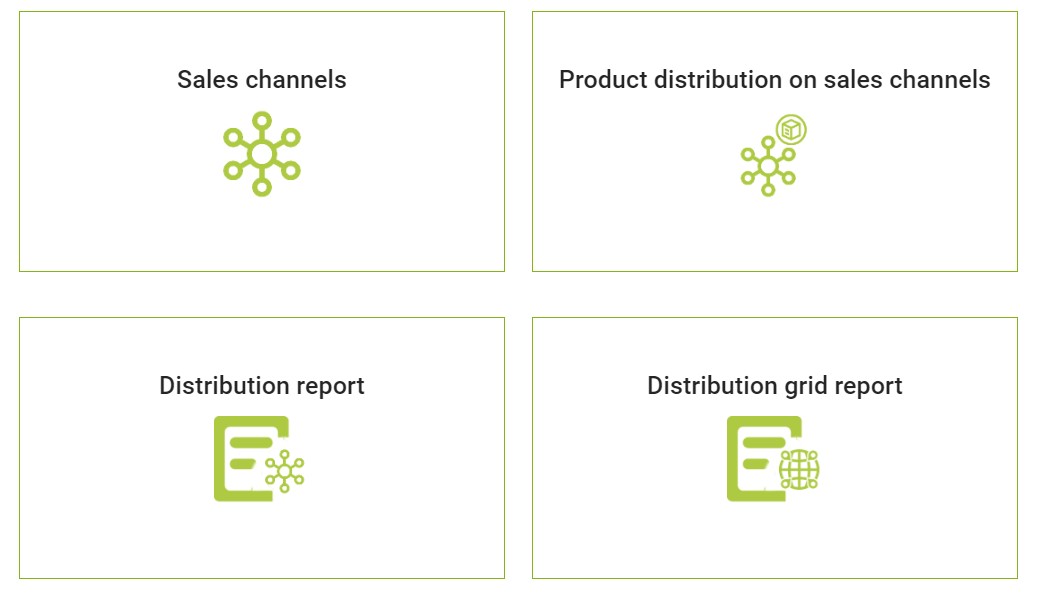
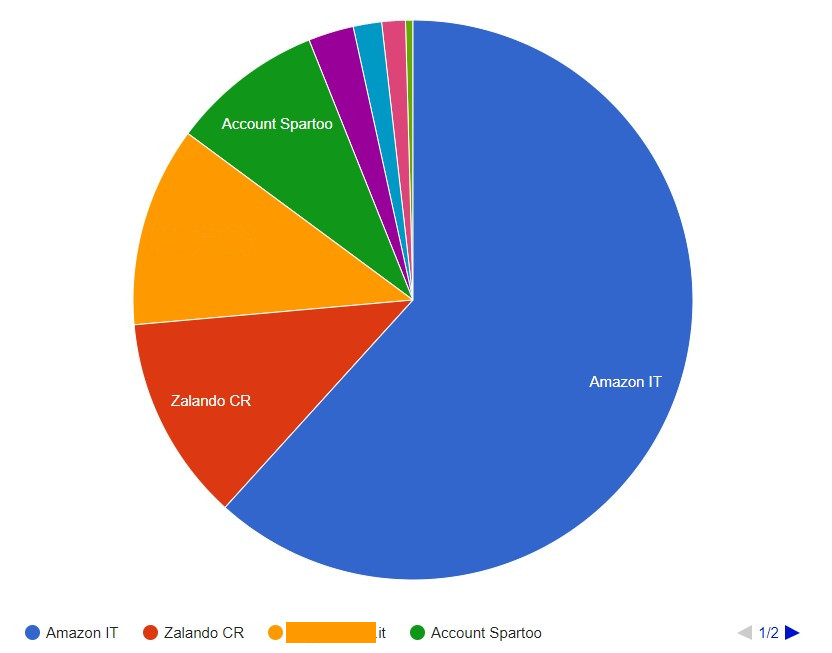
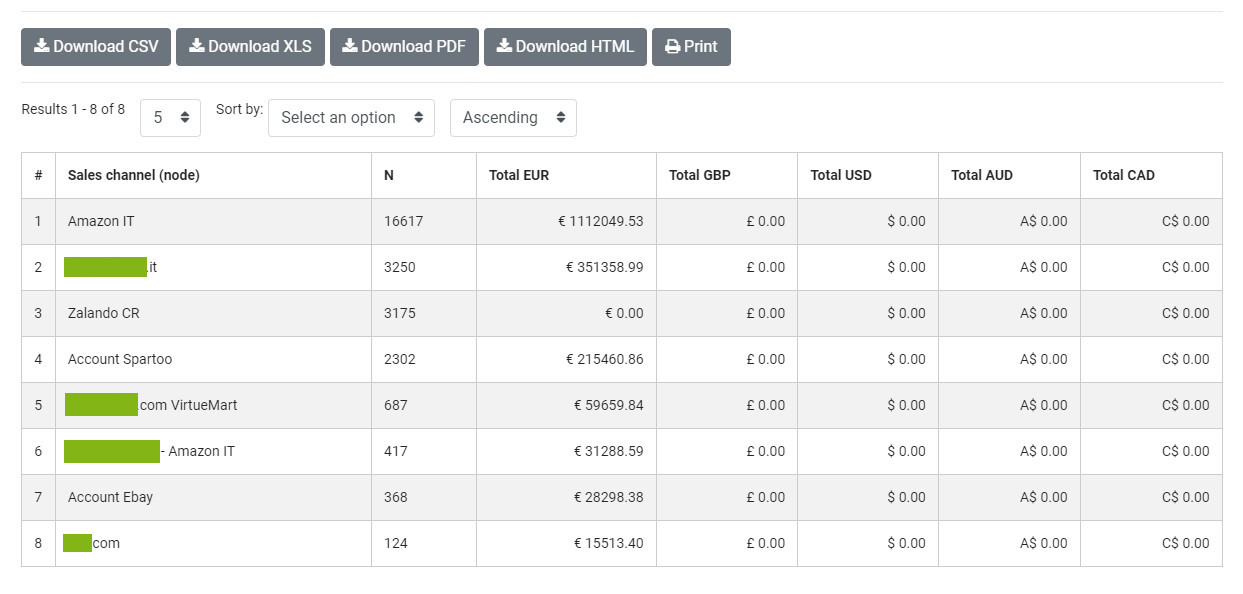
Sales by channel
Channel reports allow you to understand which sales channels (sites or marketplaces) offer the best performance, in terms of turnover or quantity of pieces sold.
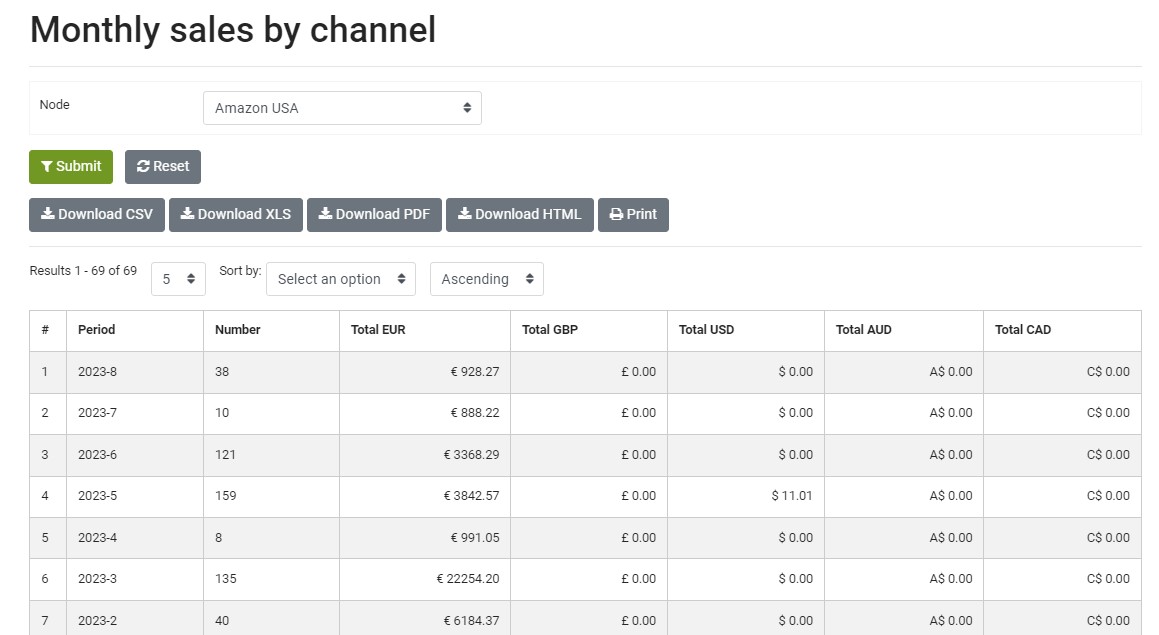
The "Orders by sales channel" report offers a snapshot relating to a specific period (for example the last month), while the "Monthly sales by channel" report allows you to observe the sales trend over time, filtering on a particular sales channel.
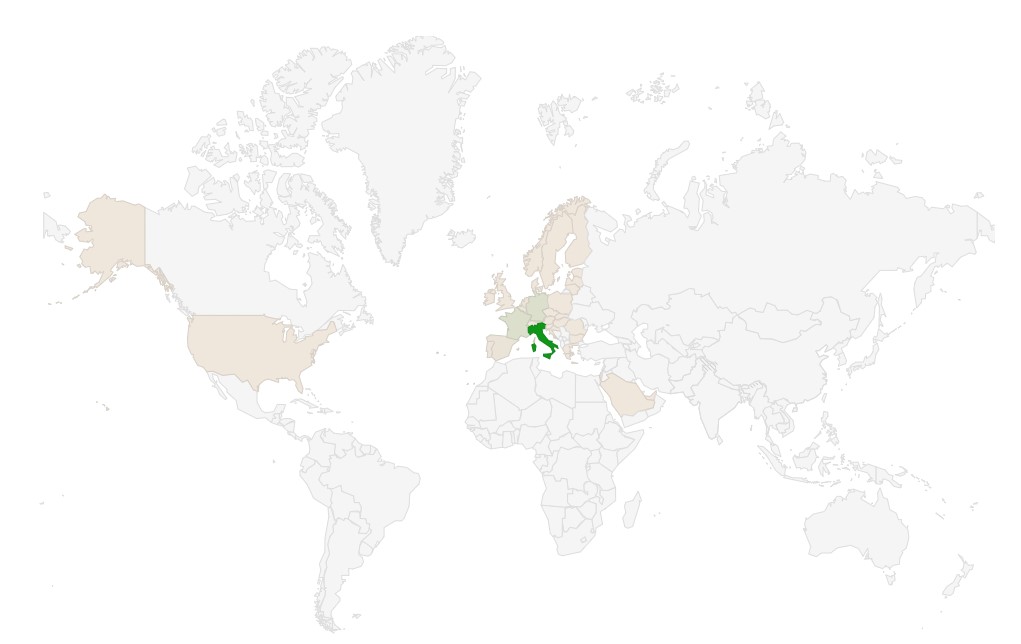
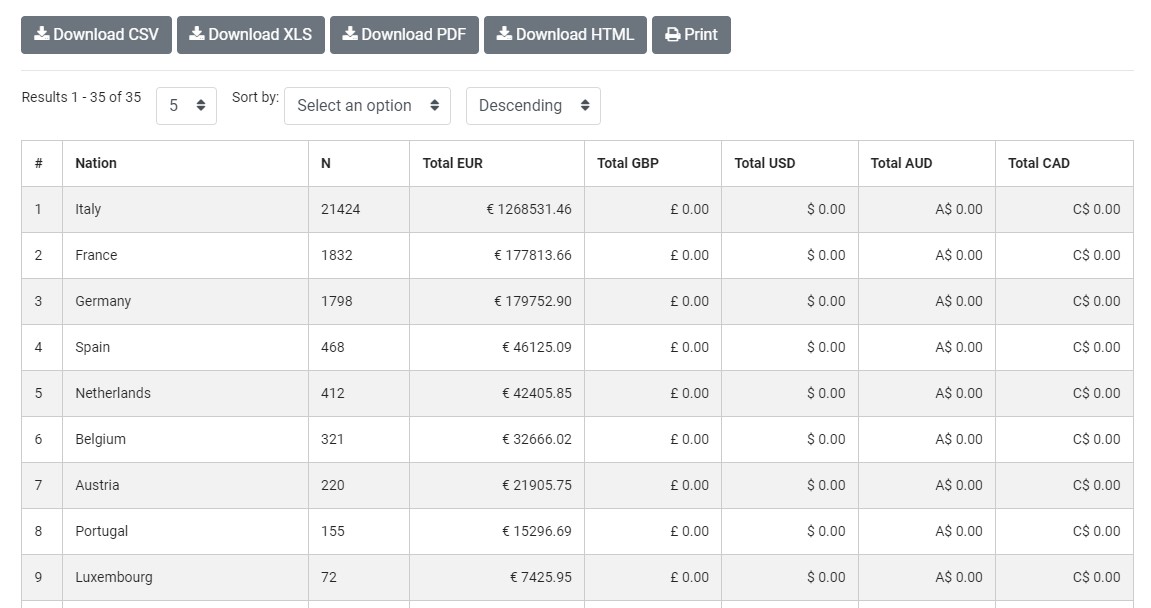
Sales by country
The "Sales by country" report makes it possible to understand in which places the seller is able to generate the greatest revenues or the greatest number of pieces sold, and therefore to be able to support any decisions to expand commercially at a geographical level.
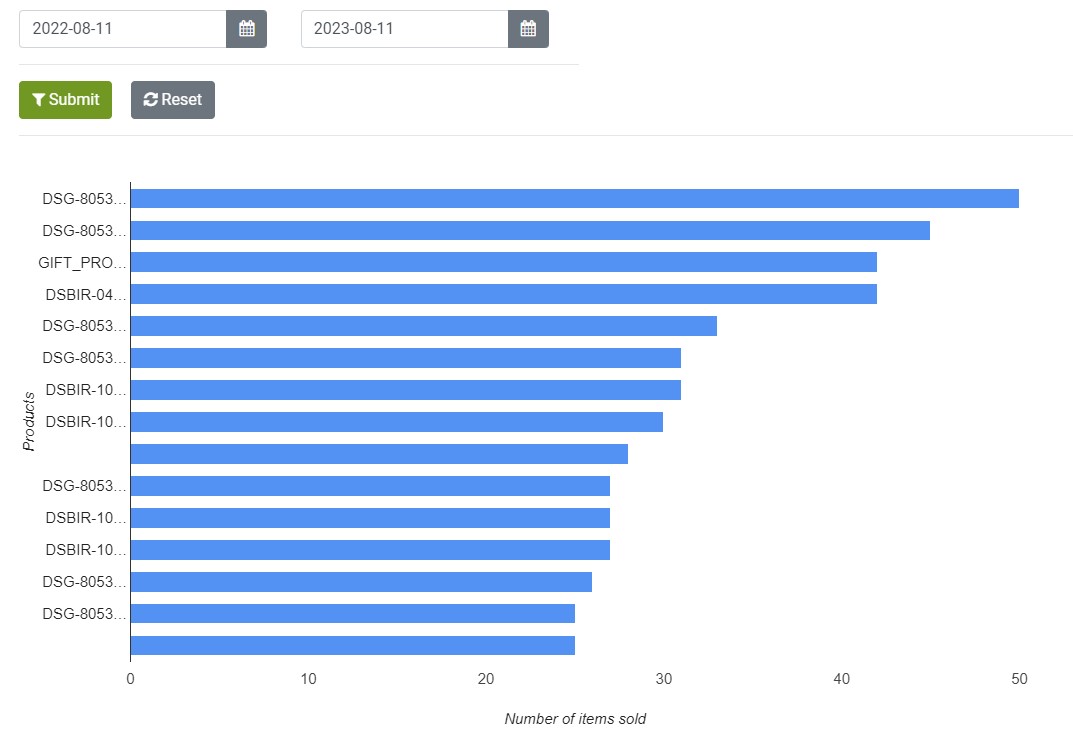
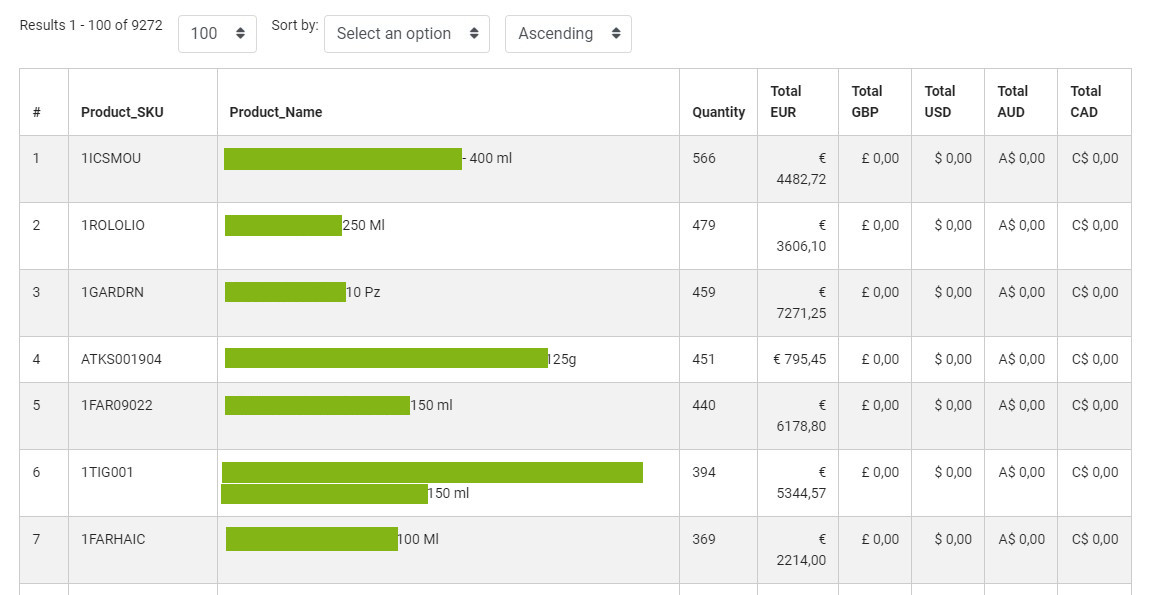
Best selling items
The analysis of the items that achieve the best sales performance can be consulted on the following reports:
Best selling items: presents the complete list of items that have achieved the highest sales (in terms of number or value) in a given period. In addition to the graphical presentation (sorted by number of pieces sold) it is possible to extract the spreadsheet complete with the quantity and value of the sales
Sales by brand: the report shows the best-selling brands, in a given period of time, possibly filtered by sales channel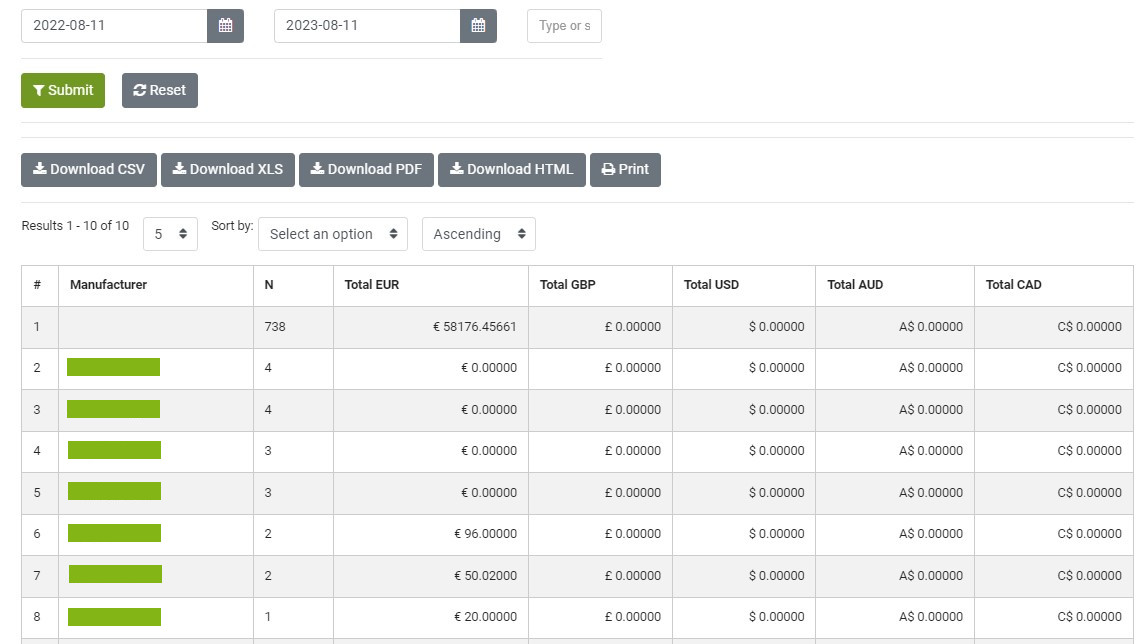
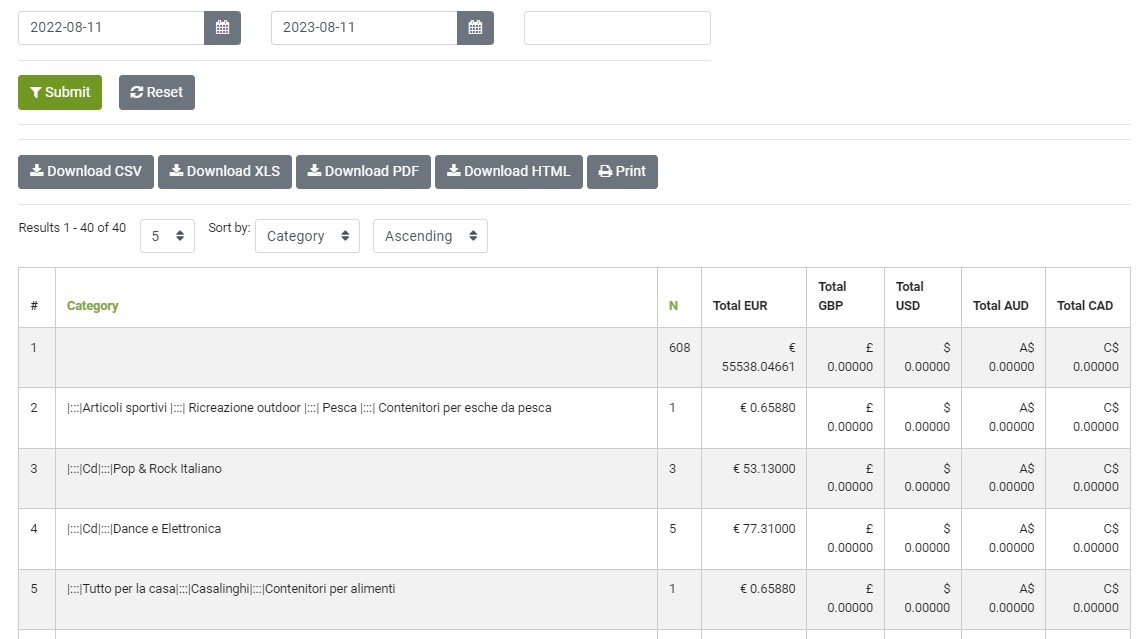
Sales by category: the report shows the best-selling categories, in a given period of time, possibly filtered by category tag
Distribution grid
It is a useful tool for analyzing the distribution of articles on the most well-known marketplaces. After identifying the target products (all or a subset of our catalogue), and the sales channels on which we want to conduct the survey (e.g. Amazon Italy, Amazon France, eBay Italy, eBay France), the system generates a report ("distribution grid") which allows you to know at a quantitative (%) and qualitative (complete list) level the products that are or are not on sale on the sales channels.
From the distribution grid it is then possible to generate filters that include the "distribution shortage" in order to be able to perform targeted operations on these items, towards the target sales channels.